Effect of Keying
Waveform on CW
Bandwidth
Jim Proctor, KE3HO
In connection with
the discussion of
keying speed versus
bandwidth, I wanted
to look at three
different keying
waveforms, each at
two different
durations (speeds).
First, I want to
explain what I mean
by keying
waveforms. In a
real CW transmitter,
the signal from the
key is filtered or
shaped in some way
to produce a
(hopefully)
desirable CW
envelope. For the
purpose of this
discussion, I am
assuming that the
keying waveform will
outline the CW
carrier envelope.
This eliminates any
ambiguity as to how
the CW pulse in
generated in the
first place.
To start with,
Figure 1 shows three
of the keying
waveforms that I am
evaluating. The
first is a
trapezoidal waveform
with 0.5 ms rise and
fall times. The
second is a
trapezoidal waveform
with 5 ms rise and
fall times. The
third is a pulse
with a raised SIN
rising and falling
edge with 5 ms rise
and fall times. In
Figure 1, all three
keying waveforms are
described as being
0.030 Sec wide.
There are various
ways to define the
pulse width (dot
speed). I chose to
define it as the
time from the
beginning of the
rising edge (key
down) to the
beginning of the
falling edge (key
up). One could
choose some other
definition, such as
width at half-max,
or the time for
which the signal is
flat. The effect of
choosing one of
these other
definitions would be
insignificant in
this analysis.
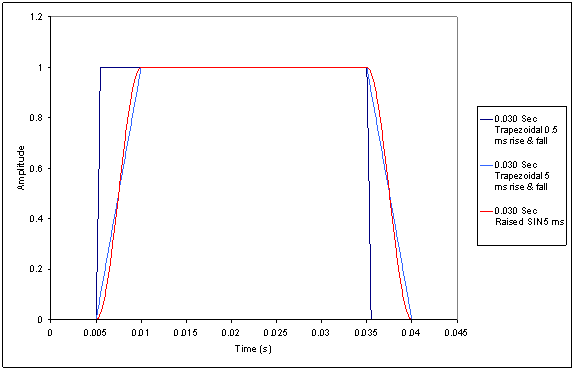
Figure 1
Figure 2 shows how
the keying waveforms
relate to the CW
envelope for the
purpose of this
analysis. You may
notice that the peak
of the sin wave does
not quite touch the
keying waveform.
This is because the
time step, or
sampling rate, that
I chose for my
analysis resulted in
data points that
fell just to either
side of the peak.
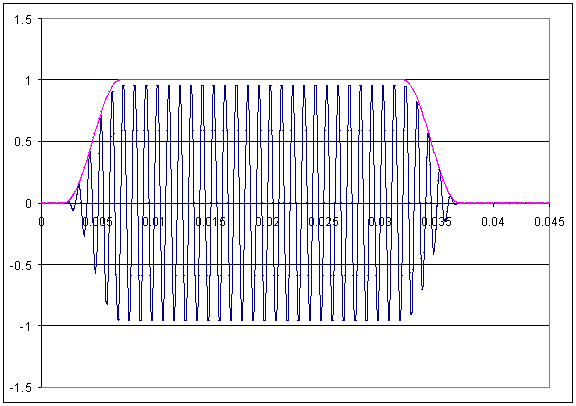
Figure 2
First, consider the
spectrum of the
keying waveforms
themselves. Figure 3
shows the spectrum
of two keying
waveforms. The red
trace is a 30 ms
wide pulse and the
blue is a 300 ms
wide pulse, both
with the 0.5 ms
trapezoidal rising
and falling edges.
This plot was
generated by
calculating the Fast
Fourier Transform (FFT)
of the waveforms
(4096 data points
were used in all FFT
calculations in this
paper the limit of
the FFT algorithm in
Microsoft Excel).
The spectrum was
calculated out to 5
kHz, but I plotted
only the first 1
kHz. Note that while
the distribution of
energy in the
spectrum is
different, the
overall envelope of
the spectrum is
nearly identical
except for small
differences at very
low frequencies
(less than 10 Hz).
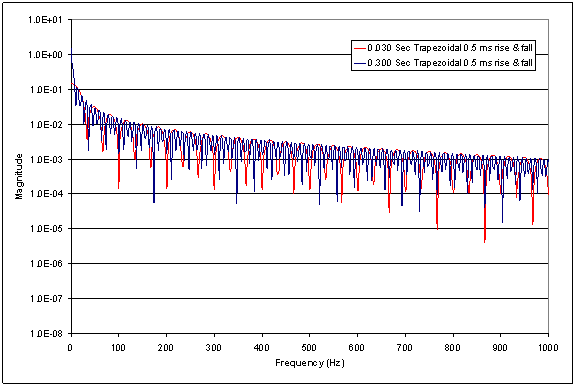
Figure 3
Figure 4 shows the
same type of plot
for 30 ms and 300 ms
pulses, this time
with the 5 ms
trapezoidal rising
and falling edges.
Again, note that the
distribution of
energy within the
spectrum is
different between
the two, but the
overall envelope of
the spectrum is
virtually unaffected
by the pulse length
except at very low
frequencies.
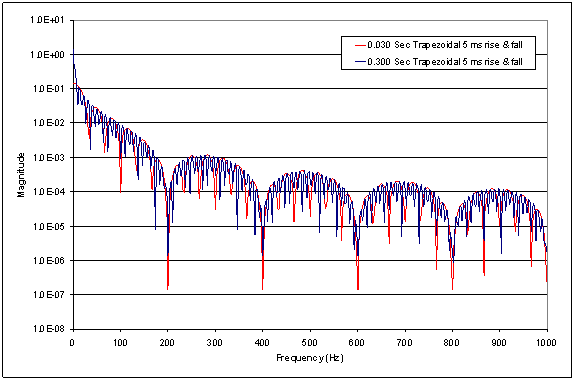
Figure 4
Figure 5 shows the
spectrum of the 30
ms and 300 ms pulses
with the raised
SIN rising and
falling edges. As
before, the
distribution of
energy in the
spectrum varies with
pulse width, but the
overall spectral
shape is unaffected
by pulse length.
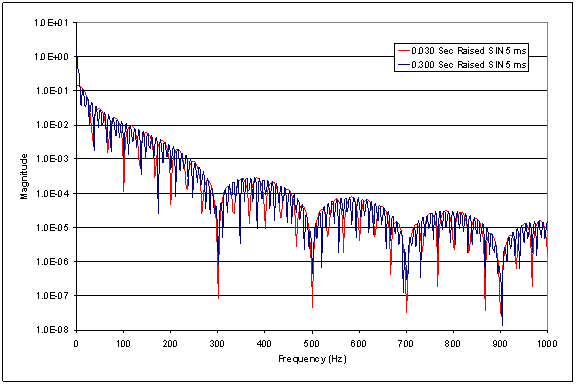
Figure 5
The graphs in
Figures 3, 4, and 5
are all plotted on
the same scale.
However, it will be
easier to make
another comparison
with some new
graphs. Figure 6
shows the spectrum
of three keying
waveforms. All three
waveforms are 300 ms
in length. The dark
blue has the 0.5 ms
trapezoidal rising
and falling edges.
Light blue is the 5
ms trapezoidal
rising and falling
edges. The red has
the raised SIN
rising and falling
edges. This shows
that the spectrum of
the 5 ms trapezoidal
keying waveform
falls more rapidly
than the other two
out to about 250 Hz.
From 250 Hz on, the
raised SIN falls
more rapidly than
the others. Figure 7
shows the same holds
true for the 30 ms
pulse length.
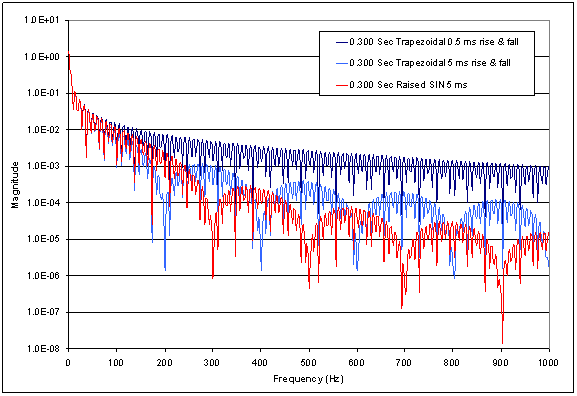
Figure 6
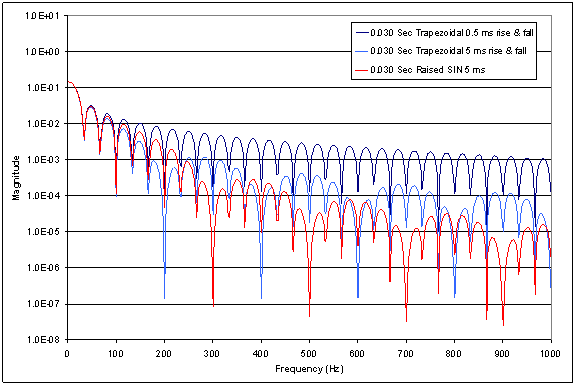
Figure 7
They say a picture
is worth a thousand
words. However, so
far I have only
shown pictures of
the spectrum of
keying waveforms.
The next set of
plots shows the
effect of these
keying waveforms on
the bandwidth of a
CW signal.
Figure 8 shows the
spectrum of a 1 kHz
carrier (Note 1)
modulated by our 30
ms and 300 ms
trapezoidal keying
waveforms with 0.5
ms rising and
falling edges.
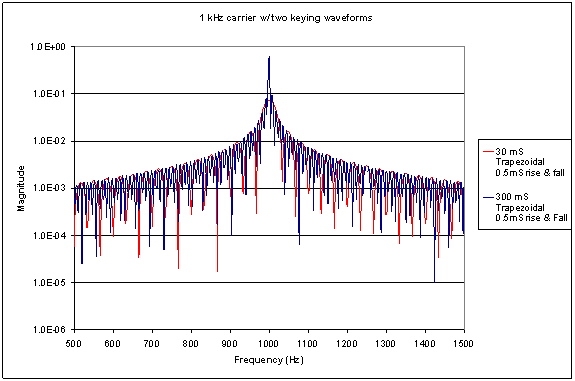
Figure 8
Figure 9 shows our 1
kHz carrier
modulated by the 30
ms and 300 ms
raised SIN keying
waveform. Again you
can see that the
distribution of
energy within the
spectrum varies with
pulse length, but
the overall spectral
shape is virtually
unaffected by pulse
length. In Figure 8
you can see that the
spectrum falls off
by roughly 2 orders
of magnitude at +/-
500 Hz from the
center frequency. In
Figure 9 you can see
that the spectrum
falls of by roughly
5 orders of
magnitude at +/- 500
Hz from the center
frequency. It can be
seen in these graphs
that the occupied
bandwidth of a CW
signal is determined
almost completely by
the shape of the
rising and falling
edges of the keying
function. If you
compare Figure 3
with Figure 8, you
can see that the
shape of the
spectrum of the CW
signal is similar to
the spectrum of the
keying waveform.
Comparing Figure 5
and Figure 9 shows a
similar
relationship. For
example, the dip in
the spectrum at
around 300 Hz in
Figure 5 can clearly
be seen at about 700
Hz and 1300 Hz (300
Hz on either side of
our carrier
frequency) in Figure
9.
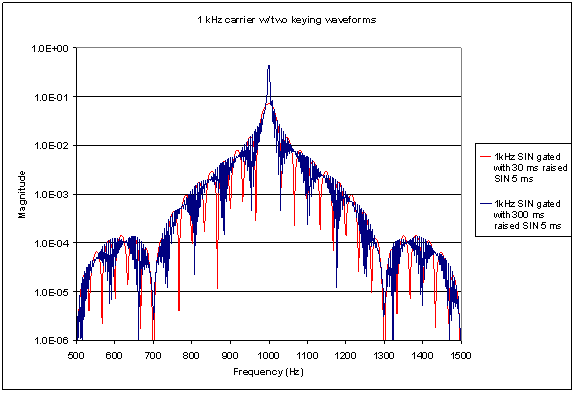
Figure 9
Finally, I want to
add one item for
consideration. If
you try to model a
real world CW
transmitter as a
black box with one
input (the key) and
one output (the RF
out) and assume that
the transfer
function between
input and output is
linear, your results
will not accurately
predict real world
behavior. Why?
Because the transfer
function of a real
transmitter is NOT
linear. It is close,
but there is a
difference between
close and close
enough. If you
dont believe this
statement, then
consider the
following question:
Why does the FCC
specify limits on
transmitted IMD
products? If the
transfer function of
the transmitter were
perfectly linear,
there would be no
IMD products to
worry about. The
fact that real
transmitters have
objectionable
transmitter IMD
products indicates
that there is
sufficient
non-linearity in the
system to generate
SIGNIFICANT amounts
of undesirable RF
(splatter, key
clicks, etc.).
Consider also that
ham gear has far
more lenient
transmitted IMD
limits than radios
for other services.
Trying to apply a
linear transfer
function to a ham
transmitter will
yield results that
do not match real
world observations.
A far more
mathematically
rigorous analysis of
this topic was
performed by Kevin
Schmidt, W9CF and
can be found at:
http://fermi.la.asu.edu/w9cf/articles/click/index.html
Note 1. I would have
preferred to study
the effects on a 1
MHz or higher
carrier frequency.
However, due to
limitations in the
FFT implementation
in Excel, it was not
possible to perform
that analysis.
However, the effect
would be similar to
what is shown here.
I hope to find a
better FFT tool to
perform that
analysis in the near
future.
|